“This AI Translator helps me understand academic materials in multiple languages while keeping the meaning accurate. It's much better than traditional translators.”

Annika Palmari
International Student
Turn notes, stats, and report excerpts into infographic layouts with Knowant’s free AI infographic generator. Paste structured text or bullet research and get a visual draft for classrooms, LinkedIn carousels, internal briefings, and blog summaries — then fact-check numbers before you publish.
No infographics generated yet
Record conversations, generate summaries and action items, then send follow-ups without rewriting the meeting.
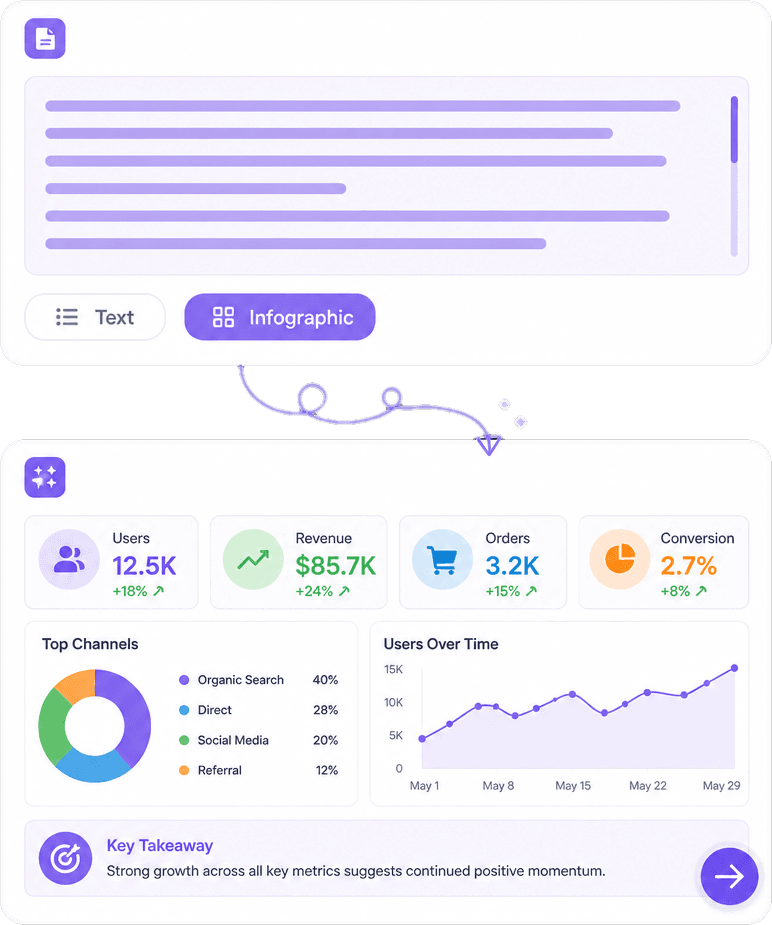
Feed clear headings and bullets rather than raw PDF noise when possible. The model groups ideas into blocks — timelines, steps, or stat callouts — based on what you provide. Cleaner input yields layouts that need fewer rewrites of titles and legend text.
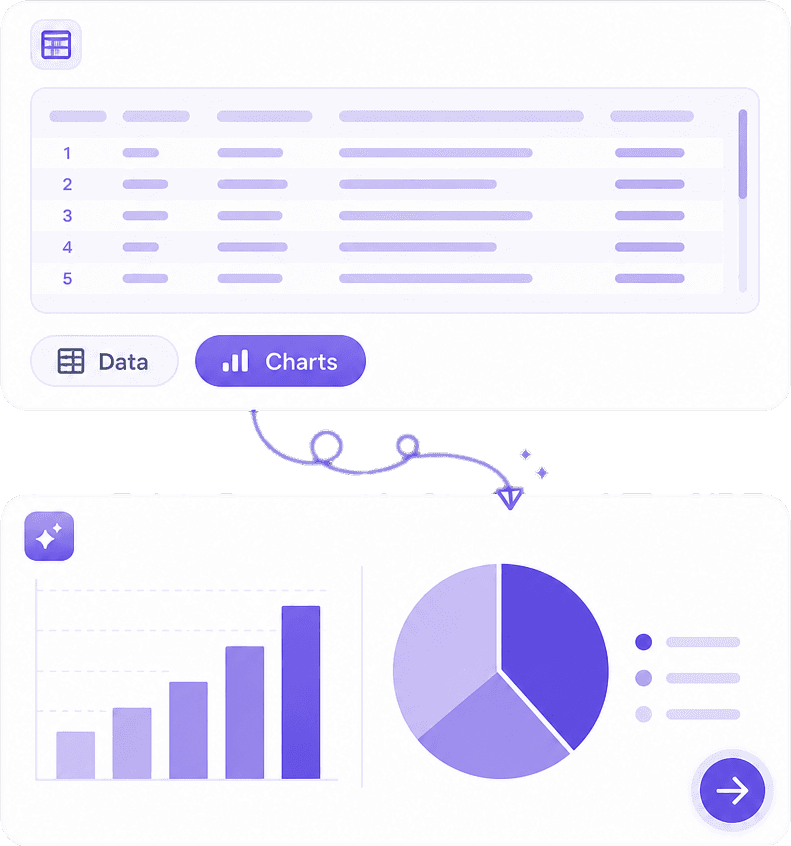
Workflows, before/after comparisons, and ranked lists translate well to infographic language. For precise charting (exact axes, regression lines), export CSV from your analytics tool or use Knowant Document on spreadsheet/PDF sources, then paste verified figures here instead of trusting invented percentages.
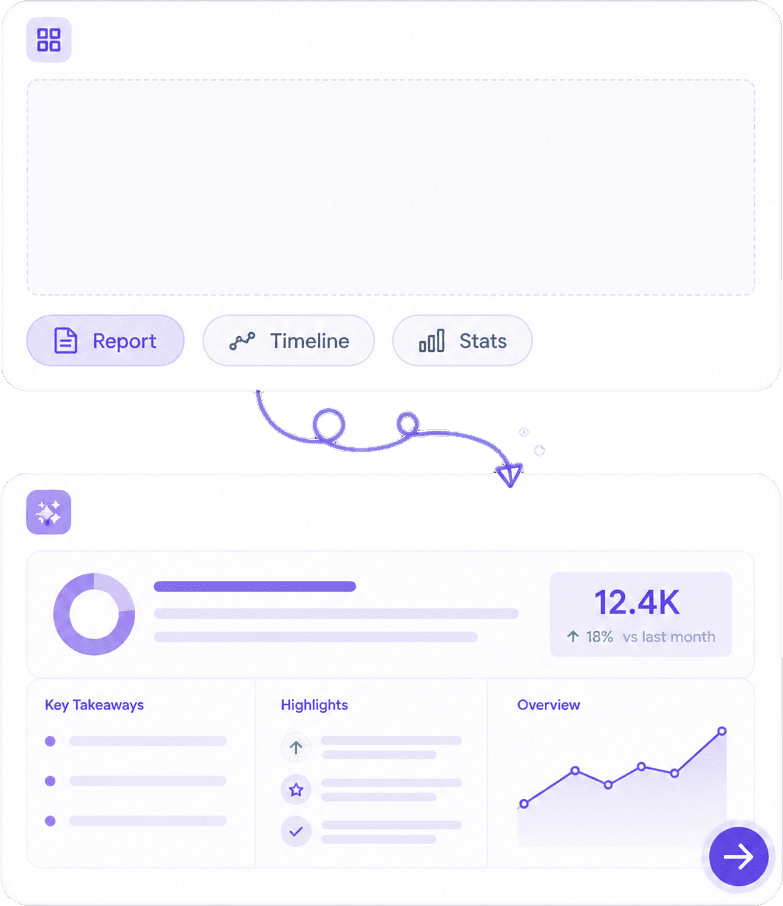
Style options steer color, density, and icon tone toward business, educational, or marketing aesthetics. Templates accelerate layout; they do not replace your style guide. Download and tweak in Figma or Canva if you must match exact fonts and logo placement.
Design tools excel when you already know every chart type; AI helps when the bottleneck is layout from messy source material. Start here for a first visual pass, then adjust copy and figures manually. Pair with Knowant Creator for image assets and Knowant Document when your source lives in PDF or spreadsheet exports.
Jump from outline to visual structure without drawing every box by hand.
Highlight KPIs and survey takeaways when the narrative matters more than interactive dashboards.
Use generated composition as a draft, not the final legal or financial document.
Export for slides, blogs, and social — resize in your editor per platform safe zones.
Supply content, choose a visual direction, generate, then verify stats and labels — three steps from outline to shareable graphic.
Paste an outline with section titles, stats you have verified, and short captions. If data is in Excel or PDF, extract or copy the table first (Knowant Document can help with PDFs: https://www.knowant.com/product/document-with-ai).
Pick a layout mood that fits the audience — corporate report, classroom poster, or social carousel. Note brand colors in the prompt or adjust after download.
Review every number and name in the graphic, fix errors, then download for your deck or post. Regenerate if section order is wrong, not if only one digit is off — edit that digit manually.
Teachers, marketers, and analysts share how AI-assisted layouts help them communicate summaries without starting from a blank canvas every time.
“This AI Translator helps me understand academic materials in multiple languages while keeping the meaning accurate. It's much better than traditional translators.”
Annika Palmari
“I use it to generate eye-catching YouTube thumbnails and social media graphics. The image quality is fantastic and saves me a lot of time.”

Ryan Hoffman
“Converting invoices and purchase reports into Excel has become effortless. The table recognition is incredibly accurate.”

Austin Distel
“I use it to generate social media posts and ads. The content is always engaging and relevant to my audience.”

Brooke cagle
Using AI for data visuals, education and marketing use cases, accuracy, exports, and how infographics differ from full dashboard BI tools.
An AI infographic generator interprets your text (and sometimes data hints) to produce a static visual with sections, icons, and short labels. Knowant’s tool helps you draft layout and visual hierarchy quickly. It is not a full business intelligence suite with live data connections.
Process steps, timelines, comparison lists, tip collections, and stat highlights work well. Highly specialized medical, legal, or financial infographics still need expert review. Use AI for structure and visuals; use subject-matter experts for claims and compliance.
You can create infographics on this page for free within current usage limits. Higher resolution, more generations, or advanced editing may require an account or paid plan. Check the tool UI for today’s caps rather than assuming unlimited exports.
Yes, for internal reports, social content, and client-facing summaries when data is accurate and on-brand. Add source lines for statistics, respect trademark and photo rights on icons, and follow your industry’s disclosure rules. AI layout does not automatically make content compliant.
Never paste vague prose like “sales increased a lot” and expect precise charts. Supply exact figures in your input, or attach a table you copied from a spreadsheet. After generation, compare every digit to the source. Regeneration can swap numbers randomly — manual correction is safer for data.
Copy the relevant sections or tables into the generator. For scanned PDFs, run OCR first so text is selectable — Knowant Document (https://www.knowant.com/product/document-with-ai) supports document workflows before you paste clean text here. Excel users often copy CSV or key rows only to reduce noise.
Those tools give manual control and brand kits; AI here proposes sectioning from your paste. Many users generate on Knowant, then import into Canva or Slides for final font and logo lockup. Creator links image generation if you need custom hero art on the same infographic.
Educators summarizing lessons, marketers repurposing blog posts, consultants packaging workshop takeaways, and students visualizing research outlines. Anyone who needs clarity fast — provided they verify facts and cite sources where grades or reputation depend on accuracy.
 Knowant
Paste article highlights, survey results, process steps, or comparison points and generate an infographic-style visual. Ideal for study guides, thought-leadership posts, onboarding one-pagers, and conference handouts — always reconcile AI-suggested numbers with your original dataset or report.